The Awesome Oscillator is a momentum indicator that helps traders predict reversals and corrections in the market. The indicator fluctuates around the zero line, with a green signal indicating bullish momentum and a red signal indicating bearish momentum. The AO is a popular tool for day traders and scalpers, but it can also be used for longer-term trading strategies.
Table of Contents
The awesome oscillator was developed by Bill Williams.
He uses the indicator to evaluate price action in the market and identify buy signals and reversal points before opening a trade. The AO is one of the most popular tools in his trade system Profitunity, which uses a variety of indicators to help find profitable opportunities.
Williams specializes in chaos theory and he believes that markets are always changing, which means individual traders need to be prepared for them. He uses the awesome oscillator to evaluate the dynamics of price movement, which is crucial for his trade system to function.
He says that the AO is a good indicator for identifying support levels and resistance levels in the market, and also for recognizing trends. The AO is especially effective when combined with other technical indicators, such as the Stochastic Oscillator and MACD.
This indicator can be useful for traders who want to make accurate trades without relying on complex algorithms. Its simplicity makes it a great choice for beginner traders and its versatility can help seasoned traders adapt to different situations and time frames.
It can be paired with other indicators for added insights into the market, and its range of functions make it ideal for any style of trading. It can be used on charts for stocks, indices, commodities, currencies, and cryptos.
The awesome oscillator uses a 5-period simple moving average to calculate its histogram. It then subtracts this from a 34-period simple moving average to determine its final histogram. The resulting histogram is then plotted on the chart.
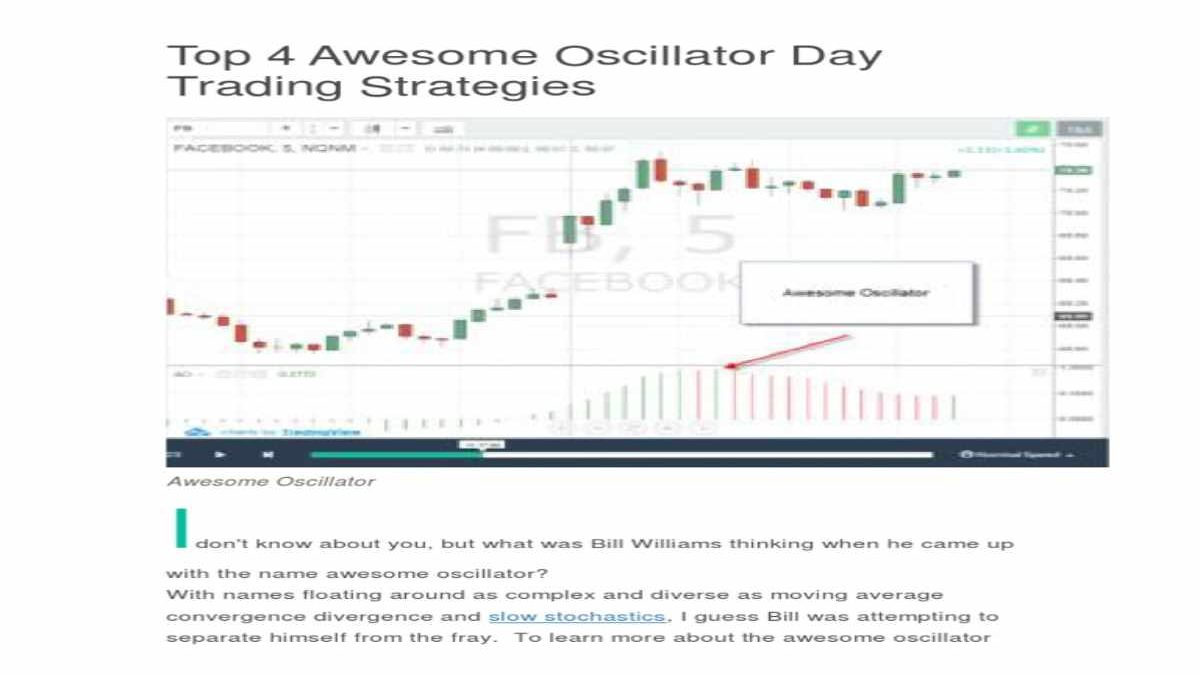
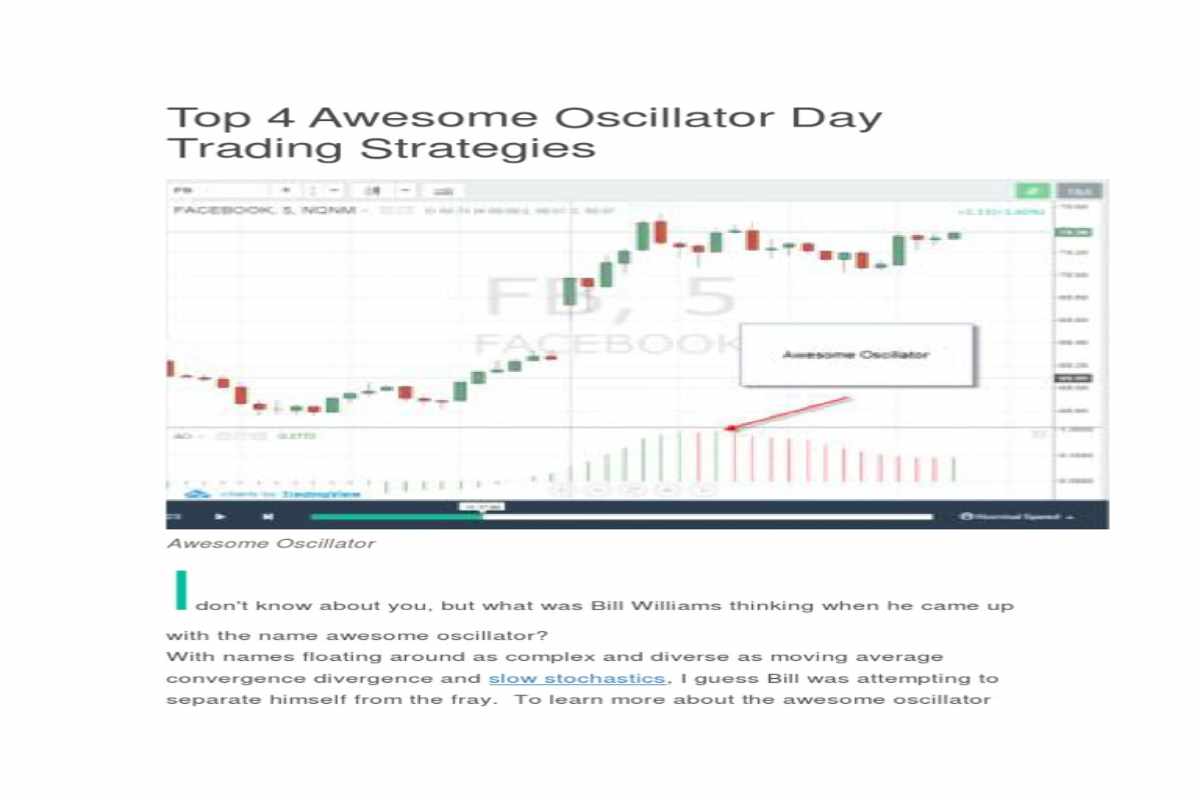
In the above example, we can see that the Awesome Oscillator histogram has been in a trending bullish trend since January of this year. The histogram has been ranging between green and red bars, but recently it has been in an upward trending channel.
When the histogram has been in this channel for a while, it may start to run out of momentum. This is called the “running out of momentum” effect, and it can be a warning sign that the trend is about to end.
This is also a common warning sign for reversals in the market, and it can be an important indicator to watch for. It is a good idea to avoid entering positions when the awesome oscillator histogram has been in this channel for too long.
It can be difficult to use the awesome oscillator in markets that are based on small-cap securities, because it has a hard time with low-float instruments. Its default settings can cause it to overshoot a price level, and it is not always accurate for this type of market.